
Current Price: 51,830
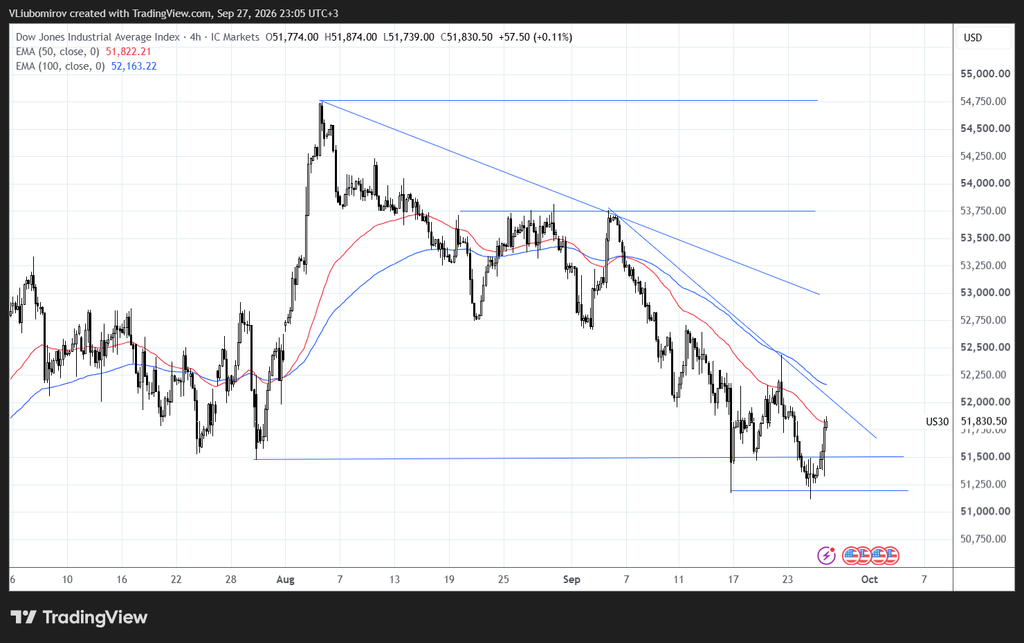
The Dow Jones Industrial Average is showing a short-term recovery after a strong decline from the September highs. However, the broader 4-hour structure remains under pressure, with price still trading below the 100 EMA and beneath a descending trendline.
🔎 Market Structure – Bearish / Recovery Phase
The 4-hour chart shows a sequence of lower highs and lower lows after the index failed to maintain the September rally.
Price recently found support around the 51,150–51,200 area and has started a short-term rebound. The latest move has pushed price back toward the 50 EMA at 51,822, which is currently acting as an important short-term reference.
The 100 EMA is positioned around 52,163, meaning the market remains below a major dynamic resistance zone.
🔴 50 EMA: 51,822
🔵 100 EMA: 52,163
For the bullish structure to strengthen, price would need to reclaim the 52,160 area and eventually break the descending trendline.
🟥 Key Resistance Levels
52,150–52,250
This is the first important resistance zone. It includes the 100 EMA and the descending structure from the recent highs.
52,500–52,750
A move above this region would indicate stronger recovery momentum and would begin to challenge the sequence of lower highs.
53,000–53,250
This area is important because it sits near the descending trendline and previous price reactions.
53,750
A major horizontal resistance level visible on the 4H chart.
54,750
The major swing-high resistance from the beginning of August.
🟢 Key Support Levels
51,500
The first important horizontal support area. Price has reacted around this level several times.
51,150–51,200
Major short-term support. This zone recently produced the current rebound.
Below 51,150
A confirmed break below this area would weaken the recovery structure and could open the way toward lower levels.
🟢 Bullish Scenario
If Dow Jones continues to hold above the 51,500 support area and successfully breaks above the 52,150–52,250 resistance zone, the recovery could gain momentum.
A sustained move above the 100 EMA near 52,163 would be an important technical development.
In that scenario, the next areas to monitor would be:
52,500 → 52,750 → 53,000–53,250
A breakout above the descending trendline would provide additional confirmation that the current recovery is becoming more significant.
🔴 Bearish / Pullback Scenario
If price fails to break above the 52,150–52,250 resistance zone and is rejected, the current rebound could turn into another pullback.
The first important level to watch would be 51,500.
A break below 51,500 would increase pressure on the recent lows around 51,150–51,200.
If the 51,150 support zone is decisively broken, the bearish structure would remain dominant and the market could begin searching for lower support.
👀 What to Watch Next
The most important short-term area is currently 51,800–52,200.
This zone contains the 50 EMA, the 100 EMA and the broader descending structure.
The market is therefore approaching a technical decision area:
🟢 Break and hold above 52,200 → stronger recovery potential
🔴 Rejection below 52,200 → possibility of another move toward 51,500
🔴 Break below 51,150 → bearish structure strengthens significantly
📊 4H Outlook
The Dow Jones is currently attempting to recover from the 51,150–51,200 support zone, but the broader 4H structure remains bearish until price can reclaim the 52,150–52,250 area and break the descending trendline.
For now, the market is positioned between important support and resistance levels, making the reaction around the 52,000–52,200 region particularly important.
Key levels to monitor:
🟢 Support: 51,500 / 51,150
🔴 Resistance: 52,150 / 52,750 / 53,250 / 53,750
📌 Major resistance: 54,750
This analysis is for educational and informational purposes only and does not constitute financial advice.