
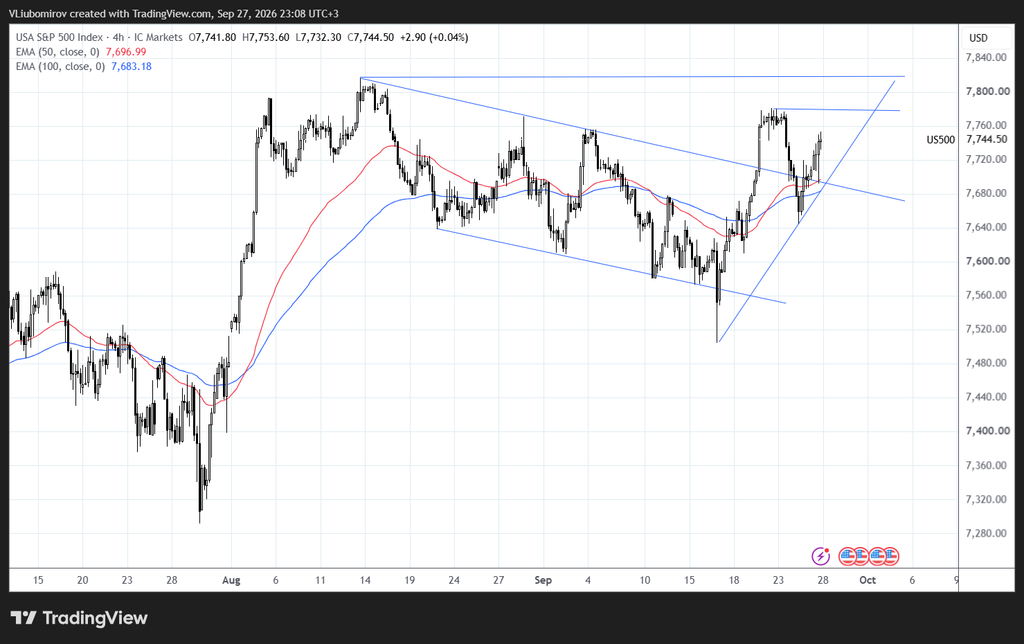
Current Price: 7,744
The S&P 500 is showing a strong short-term recovery after finding support near the lower part of the recent consolidation range. Price has moved back above both the 50 EMA and 100 EMA, while the index is now approaching an important resistance zone near the recent highs.
🔎 Market Structure – Bullish Recovery
The 4-hour chart shows that the S&P 500 has recovered strongly from the 7,500–7,560 area.
Price is currently trading above both major exponential moving averages:
🟢 50 EMA: 7,696.99
🔵 100 EMA: 7,683.18
This is a positive short-term development, although price is now approaching the upper resistance area around 7,760–7,780.
A sustained breakout above this zone would strengthen the bullish structure and could open the way toward a retest of the recent highs.
🟥 Key Resistance Levels
7,760–7,780
The first major resistance zone. Price recently reacted strongly around this area and is now approaching it again.
7,810–7,820
Major resistance near the recent August highs and the upper horizontal structure.
7,840
The next important upside reference visible on the chart.
A breakout above this region would represent a clear continuation of the current recovery.
🟢 Key Support Levels
7,700–7,680
The most important short-term support zone. This area contains both the 50 EMA and 100 EMA.
7,640–7,600
Secondary support from previous reactions during the September consolidation.
7,550–7,560
Major structural support and the lower boundary of the recent decline.
7,500
Important psychological and technical support below the recent swing low.
🟢 Bullish Scenario
If price maintains its position above the 7,700–7,680 EMA zone and breaks above 7,760–7,780, the current recovery could continue.
A confirmed breakout above the recent highs around 7,810–7,820 would strengthen the bullish structure further.
Potential upside areas would then be:
7,780 → 7,820 → 7,840
A sustained move above 7,820 would also represent a breakout from the recent consolidation structure.
🔴 Bearish / Pullback Scenario
If price is rejected around 7,760–7,780, a short-term pullback toward the moving averages would be possible.
The first area to monitor would be 7,700–7,680.
If price loses both the 50 EMA and 100 EMA, the recovery would weaken and attention could shift toward:
7,640 → 7,600 → 7,550
A decisive break below 7,550–7,560 would significantly weaken the current recovery structure.
👀 What to Watch Next
The most important short-term zone is:
7,680–7,780
This area contains the two major moving averages on the downside and the first major resistance on the upside.
The market is approaching a technical decision area:
🟢 Break above 7,780 → bullish momentum strengthens
🟢 Break above 7,820 → potential continuation toward 7,840
🔴 Rejection from 7,760–7,780 → possible pullback toward the EMAs
🔴 Break below 7,680 → recovery loses momentum
📊 4H Outlook
The S&P 500 has shifted into a short-term bullish recovery after finding support near the 7,500–7,560 region.
Price is currently above both the 50 EMA and 100 EMA, which supports the short-term bullish structure. However, the index is approaching significant resistance around 7,760–7,780, followed by the recent highs around 7,810–7,820.
The reaction around these levels should determine whether the current move develops into a broader breakout or another rejection within the existing range.
Key levels to monitor:
🟢 Support: 7,700 / 7,680 / 7,600 / 7,550
🔴 Resistance: 7,760 / 7,780 / 7,820 / 7,840
This analysis is for educational and informational purposes only and does not constitute financial advice.