
📅 September 27, 2026
Current Price: 30,642
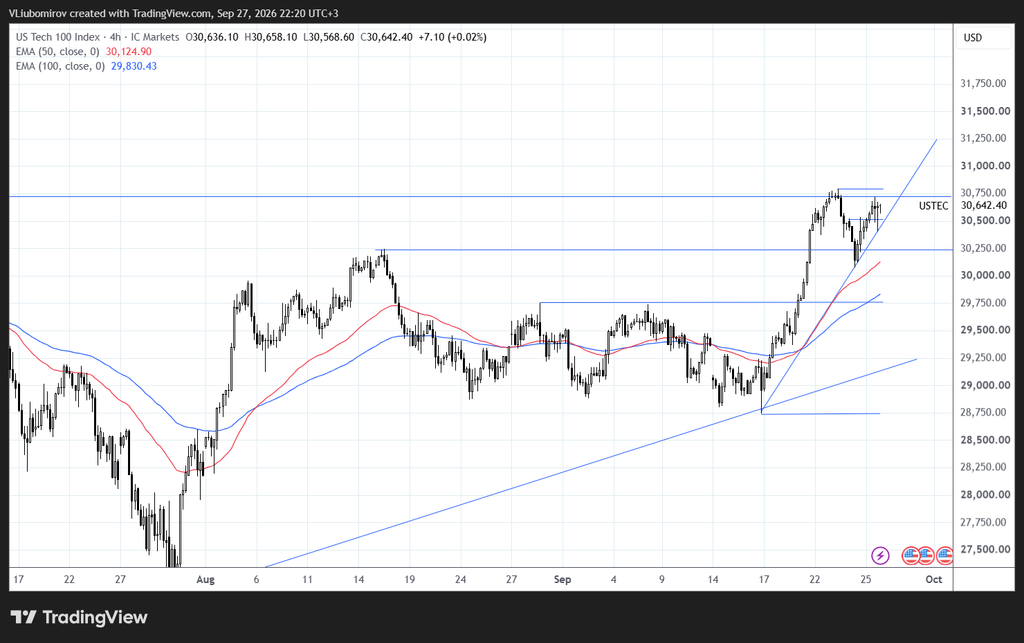
The NASDAQ 100 continues to show a strong bullish structure on the 4-hour timeframe, with price holding above both major exponential moving averages. After the strong rally from the 28,750–29,000 area, the market has entered a short-term consolidation phase near the recent highs.
🟢 Market Structure – Bullish
The overall 4H structure remains bullish.
Price is currently trading above:
🔴 50 EMA: 30,125
🔵 100 EMA: 29,830
Both moving averages are positioned below the current market price, supporting the broader upward structure.
The recent move from approximately 28,750 to above 30,700 represents a significant bullish expansion. During this move, price broke through the previous resistance around 29,750, which is now an important area to watch as potential support.
The current consolidation close to the highs is important because the market is testing whether buyers can generate enough momentum for another breakout.
📈 Key Resistance Levels
🔴 30,750
This is currently the most important short-term resistance.
Price has approached this area several times, but a decisive breakout has not yet been established.
A strong 4H close above 30,750, followed by confirmation, could open the way toward higher levels.
🟢 31,250
If 30,750 is broken convincingly, the next major upside area visible on the chart is around:
31,250
This would represent a new expansion of the current bullish structure.
📉 Key Support Levels
🟢 30,250
First important short-term support.
A pullback toward this area would still leave the immediate bullish structure relatively intact.
🔴 30,125 – 50 EMA
The 50 EMA is currently around 30,125.
This is an important dynamic support level because it is closely aligned with the current bullish structure.
🟡 29,750
This is a particularly important level.
It previously acted as resistance and was later broken during the strong upside move. If price returns to this area, the reaction could provide useful information about whether the previous breakout remains valid.
🔵 29,830 – 100 EMA
The 100 EMA is currently around 29,830, providing another layer of medium-term support.
⚠️ 28,750
This remains a major structural support zone and the origin of the latest strong bullish move.
🟢 Bullish Scenario
If buyers manage to push NASDAQ above 30,750 and establish a sustained breakout, bullish momentum could increase.
The next major level to monitor would then be:
🎯 31,250
A successful breakout would strengthen the current bullish market structure and potentially indicate another upward expansion.
🔴 Bearish / Pullback Scenario
If price continues to struggle around 30,750 and sellers take control, a short-term retracement could develop.
The first area to watch would be:
30,250
A deeper pullback could then bring price toward:
30,125 – 50 EMA
and potentially:
29,750 – previous breakout zone
A break below these support areas would weaken the current short-term bullish structure and increase the importance of the 29,830–100 EMA area.
🔎 What to Watch Next
The most important area on the chart right now is the 30,750 resistance zone.
📈 Above 30,750: attention shifts toward 31,250.
↔️ Between 30,250 and 30,750: the market remains in a consolidation phase.
📉 Below 30,250: watch 30,125, followed by the important 29,750 area.
The relationship between price and the 50/100 EMAs will also remain important for determining whether the current bullish structure is maintained.
📌 4H Outlook
Current structure: 🟢 Bullish
Resistance: 30,750 → 31,250
Support: 30,250 → 30,125 → 29,750 → 29,830
Major support: 28,750
For now, NASDAQ remains in a bullish 4H structure, but the market is approaching an important resistance area. The reaction around 30,750 could provide the next significant directional signal.
This analysis is provided for informational and educational purposes only and does not constitute financial or investment advice. Markets can move rapidly, especially around major economic events. Always conduct your own research and manage your risk before making any trading decision.