
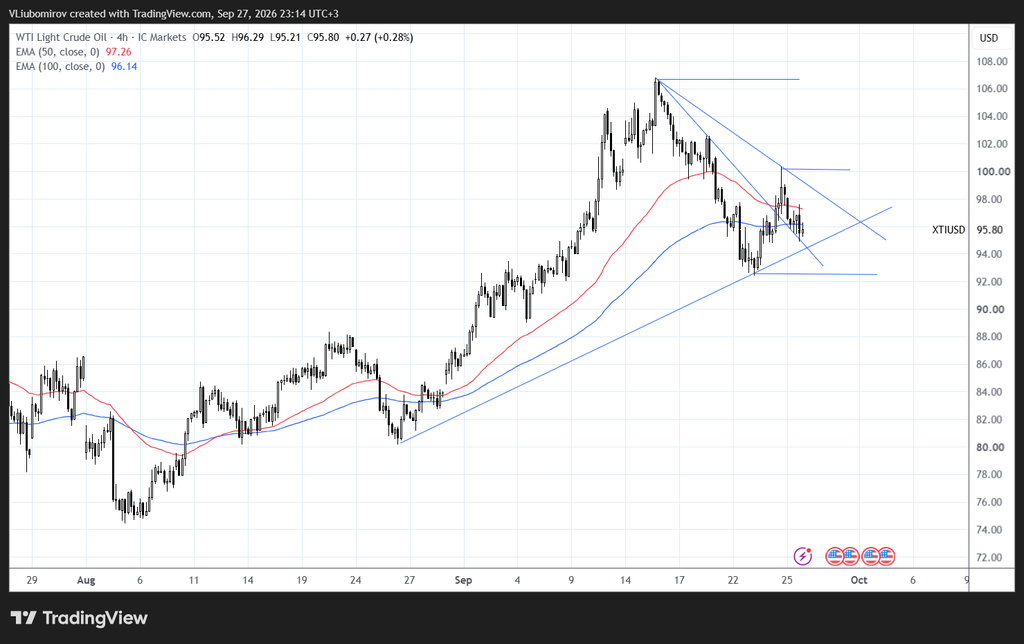
Current Price: 95.80
WTI crude oil remains within a broader bullish structure after the strong rally from the August lows. However, the market is currently undergoing a correction from the September high near 106.50.
Price is now trading below both the 50 EMA and 100 EMA, while the recent candles are forming inside a contracting structure between descending resistance and rising support.
🔎 Market Structure – Bullish Trend / Short-Term Correction
WTI rallied strongly from the 80–82 area during August and reached a major high near 106.50 in September.
Since that high, price has formed a series of lower highs and moved back toward the 92.50–93.00 support zone.
The current price is below both moving averages:
🔴 50 EMA: 97.26
🔵 100 EMA: 96.14
This indicates short-term weakness, although the larger recovery structure remains intact as long as the rising support trendline and the 92.50–93.00 area hold.
🟥 Key Resistance Levels
96.10–97.30
The first important resistance zone. It contains the 100 EMA and 50 EMA.
98.00–100.00
A major psychological and technical resistance area. The market has reacted several times around this region.
102.00–103.00
Important resistance from the recent September decline.
106.50–106.70
Major swing-high resistance and the highest level visible on the current chart.
🟢 Key Support Levels
94.00–95.00
Short-term support around the current consolidation area.
92.50–93.00
The most important current support zone. It has already produced a strong reaction and coincides with the rising trend structure.
90.00–91.00
Secondary support if the 92.50–93.00 zone fails.
84.00–86.00
Major deeper support from the previous breakout structure.
🟢 Bullish Scenario
If WTI manages to hold above the 92.50–93.00 support zone and breaks back above the 96.10–97.30 EMA area, the short-term structure would begin to improve.
A sustained move above 97.30 could open the way toward:
98.00 → 100.00 → 102.00
A breakout above 102–103 would significantly strengthen the bullish continuation scenario and bring the September high around 106.50 back into focus.
🔴 Bearish / Pullback Scenario
If price remains below the 96–97.30 EMA zone and sellers regain control, WTI could retest the 94–95 area.
A decisive break below 92.50–93.00 would be more significant because this zone is supporting the current rising structure.
If this support fails, the next areas to monitor would be:
91.00 → 90.00 → 86.00
A sustained break below the rising trendline would also weaken the broader bullish structure that has developed since August.
👀 What to Watch Next
The key short-term zone is:
92.50–97.30
This range contains the major support structure on the downside and both moving averages on the upside.
The market is approaching an important technical decision:
🟢 Break above 97.30 → short-term recovery strengthens
🟢 Break above 100 → bullish momentum improves further
🟢 Break above 102–103 → potential continuation toward 106.50
🔴 Rejection below 97.30 → correction remains active
🔴 Break below 92.50 → broader bullish structure weakens
📊 4H Outlook
WTI remains in a short-term corrective phase following the strong rally toward 106.50.
The larger structure is still supported by the rising trendline from the August lows, but price currently remains below both the 50 EMA (97.26) and 100 EMA (96.14).
The 92.50–93.00 region is therefore particularly important. Holding this area could allow another recovery attempt, while a confirmed breakdown would indicate that the correction is becoming deeper.
For the bullish structure to regain momentum, WTI needs to reclaim 96.10–97.30, followed by the psychological 100 level.
Key levels to monitor:
🟢 Support: 95.00 / 93.00 / 92.50
🔴 Resistance: 96.14 / 97.26 / 100.00 / 102.00–103.00
📌 Major resistance: 106.50
This analysis is for educational and informational purposes only and does not constitute financial advice.