
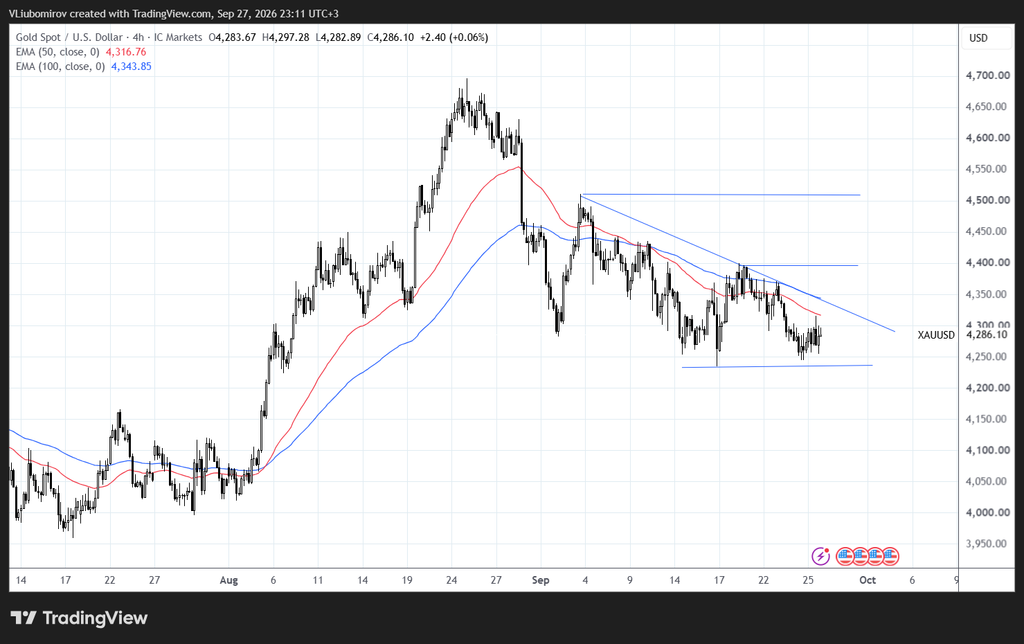
Current Price: 4,286
Gold remains under short-term pressure on the 4-hour timeframe after forming a series of lower highs and lower lows from the September peak. Price is currently trading below both the 50 EMA and 100 EMA, while a descending trendline continues to act as dynamic resistance.
🔎 Market Structure – Bearish / Consolidation
After reaching a major high near 4,650–4,700, Gold entered a corrective phase and has continued to trade below the descending trendline.
Current moving averages:
🔴 50 EMA: 4,316.76
🔵 100 EMA: 4,343.85
Price at 4,286 remains below both averages, which keeps the short-term structure bearish.
However, the market is approaching an important support zone around 4,230–4,250, where buyers have previously stepped in.
🟥 Key Resistance Levels
4,315–4,345
The first important resistance zone. It contains both the 50 EMA and 100 EMA.
4,390–4,400
Major horizontal resistance and an important area where previous price reactions occurred.
4,500–4,510
Strong resistance and the upper boundary of the recent structure.
4,600–4,650
Major resistance from the previous rally highs.
🟢 Key Support Levels
4,250–4,230
The most important current support zone. Price has repeatedly reacted around this area.
4,200
Secondary psychological and technical support.
4,100–4,150
A deeper support area that could become relevant if the current support fails.
🟢 Bullish Scenario
If Gold continues to hold the 4,230–4,250 support zone and begins to recover, the first important test would be the 4,315–4,345 EMA area.
A sustained move above the 100 EMA around 4,344 would improve the short-term structure.
If price then breaks above 4,400, the recovery could extend toward:
4,400 → 4,500 → 4,510
A breakout above 4,500–4,510 would represent a much stronger bullish development and would challenge the current descending structure.
🔴 Bearish / Pullback Scenario
If Gold fails to reclaim the 4,315–4,345 EMA zone and sellers remain in control, the market could retest the 4,250–4,230 support area.
A decisive break below 4,230 would weaken the current structure further and could open the way toward:
4,200 → 4,150 → 4,100
The descending trendline remains an additional bearish factor while price stays below it.
👀 What to Watch Next
The most important short-term area is currently:
4,230–4,345
This range contains the major support zone on the downside and both moving averages on the upside.
The market is approaching a technical decision area:
🟢 Hold above 4,230–4,250 → possibility of a recovery
🟢 Break above 4,345 → short-term structure improves
🟢 Break above 4,400 → stronger bullish momentum
🔴 Rejection below 4,345 → bearish pressure remains
🔴 Break below 4,230 → potential continuation lower
📊 4H Outlook
Gold is currently in a bearish corrective structure on the 4-hour timeframe.
Price remains below both the 50 EMA (4,316.76) and 100 EMA (4,343.85), while the descending trendline continues to limit upside moves.
The 4,230–4,250 region is therefore particularly important. A successful defense of this area could produce another recovery attempt, while a confirmed breakdown would strengthen the bearish structure.
For the bullish structure to improve significantly, Gold would first need to reclaim 4,345 and then challenge the 4,400 resistance area.
Key levels to monitor:
🟢 Support: 4,250 / 4,230 / 4,200
🔴 Resistance: 4,315 / 4,345 / 4,400 / 4,500
This analysis is for educational and informational purposes only and does not constitute financial advice.