
Market Structure
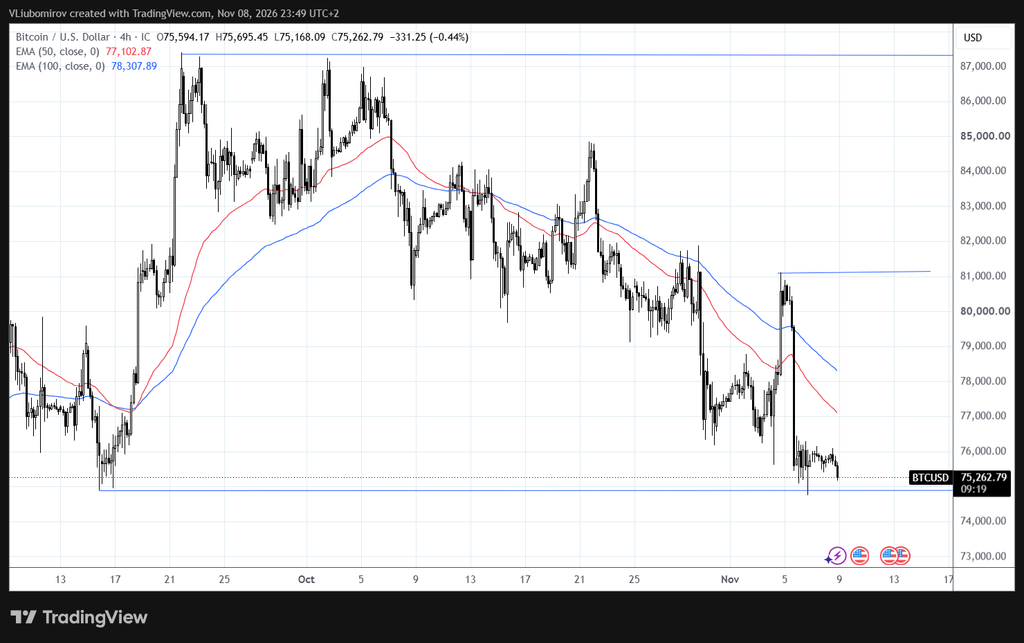
Bitcoin remains under significant selling pressure on the 4H timeframe. Following the rejection from the $80,500–$81,000 resistance area, the market experienced another sharp decline, breaking below previous consolidation levels.
The price is currently trading around $75,263, approaching an important support zone near $74,800–$74,900.
The overall structure continues to show lower highs and lower lows, confirming that sellers remain in control.
Moving Averages
EMA 50: $77,102.87
EMA 100: $78,307.89
Both moving averages are pointing downward, with EMA 50 below EMA 100. This bearish alignment confirms the negative market momentum.
The price is trading significantly below both averages, indicating that buyers have yet to regain control.
Key Resistance Levels
$76,000–$76,300 – Immediate resistance and recent consolidation area.
$77,100 – EMA 50 resistance.
$78,300 – EMA 100 resistance.
$81,000 – Major resistance and previous breakdown area.
Key Support Levels
$74,800–$74,900 – Immediate and important support zone.
$74,000 – Psychological support.
$73,000 – Potential next downside target if selling pressure accelerates.
Bullish Scenario
Bitcoin needs to defend the $74,800–$74,900 support zone to avoid further downside.
A successful recovery above $76,000–$76,300 could provide the first indication of improving short-term momentum.
A sustained move above $77,100 would strengthen the recovery scenario and potentially open the way toward $78,300.
However, a more meaningful bullish reversal would require the price to reclaim the EMA 100 and break the sequence of lower highs.
Bearish Scenario
The bearish structure remains dominant.
If Bitcoin fails to hold the $74,800–$74,900 support zone, a confirmed breakdown could trigger another wave of selling toward $74,000.
Further weakness could expose the $73,000 area.
As long as the price remains below both moving averages, recovery attempts may encounter significant selling pressure.
Technical Outlook
Bitcoin remains in a clear bearish phase on the 4H timeframe.
The downward-sloping moving averages, persistent lower highs, and failure to recover above previous support levels indicate that sellers maintain control.
The $74,800–$74,900 zone is the key level to watch in the immediate outlook. Holding this support could allow a temporary recovery, while a confirmed breakdown would increase the probability of further declines.
For now, the short-term bias remains bearish, with any recovery toward $76,000–$77,100 potentially facing resistance.
Key Levels to Watch
Resistance: $76,000–$76,300 | $77,100 | $78,300 | $81,000
Support: $74,800–$74,900 | $74,000 | $73,000
Bullish above: $76,300
Bearish below: $74,800
Disclaimer: Our market analysis is provided for informational and educational purposes only and should not be considered financial or investment advice or a recommendation to trade. The analysis represents a possible market perspective, and markets can move in any direction at any time. Always conduct your own research and manage your risk before making any trading decision.