
Market Structure
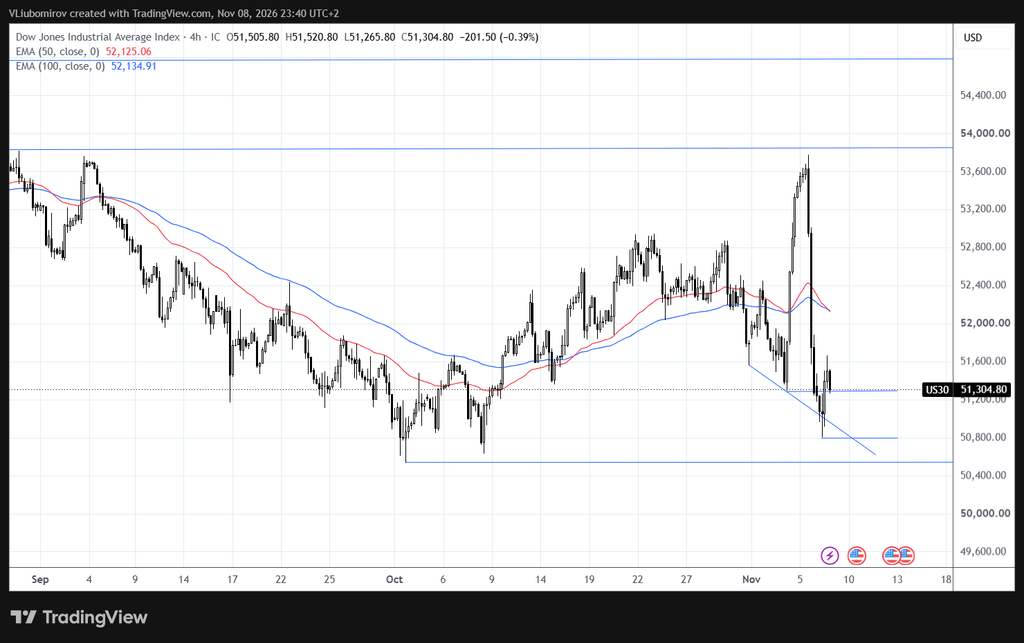
Dow Jones remains under bearish pressure following a sharp rejection from the 53,600 resistance area. The recent sell-off pushed the index below both the 50 and 100 EMAs, confirming a weakening market structure.
The price is currently attempting to stabilize around 51,300 after a strong downward move. However, the formation of lower highs and lower lows continues to favor sellers.
Moving Averages
EMA 50: 52,125
EMA 100: 52,135
Both moving averages are positioned above the current price and are converging around 52,100–52,150, creating an important resistance zone.
Key Resistance Levels
51,600 – Immediate resistance.
52,100–52,150 – EMA 50 and EMA 100 resistance zone.
52,400–52,800 – Additional resistance area.
53,850 – Major resistance.
Key Support Levels
51,300 – Immediate support.
50,800 – Important short-term support.
50,500 – Major support and potential downside target.
Bullish Scenario
A recovery above 51,600 could provide the first indication of short-term stabilization.
A sustained move above this level could open the way toward 52,100–52,150, where both moving averages are likely to act as resistance.
A successful break above the EMA zone would improve the overall technical outlook and could create room for a recovery toward 52,400.
Bearish Scenario
Failure to reclaim 51,600, followed by renewed selling pressure, could push the index toward 50,800.
A confirmed breakdown below 50,800 would expose the next major support around 50,500.
As long as the price remains below both moving averages, the bearish scenario remains dominant.
Technical Outlook
The overall 4H structure remains bearish. The sharp rejection from recent highs, combined with the breakdown below both moving averages, indicates that sellers currently maintain control.
The 51,600 level is important for the short-term direction, while 50,800 remains the key support to watch.
A sustained recovery above the moving averages would be needed to signal a potential shift in market sentiment.
Key Levels to Watch
Resistance: 51,600 | 52,100–52,150 | 52,400–52,800
Support: 51,300 | 50,800 | 50,500
Bullish above: 51,600
Bearish below: 50,800
Disclaimer: Our market analysis is provided for informational and educational purposes only and should not be considered financial or investment advice or a recommendation to trade. The analysis represents a possible market perspective, and markets can move in any direction at any time.