
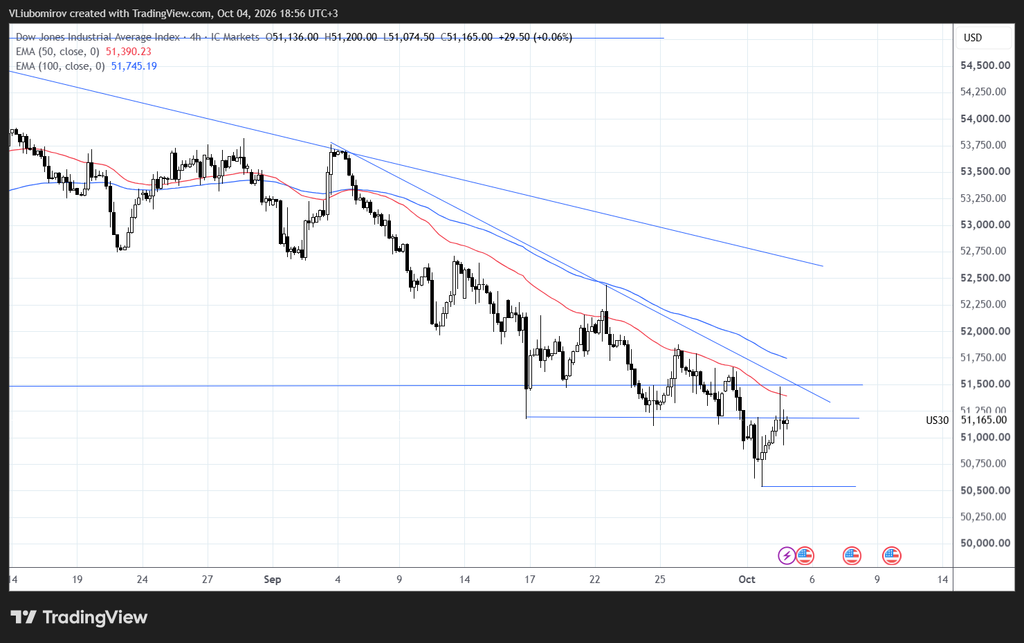
Current Price: 51,165
Timeframe: 4H
Market: Dow Jones Industrial Average
Market Structure
Dow Jones remains in a bearish 4H structure. Since the beginning of September, the index has continued to form lower highs and lower lows, while price remains below the major descending trendlines.
The current price around 51,165 is also below both moving averages:
- 50 EMA: 51,390
- 100 EMA: 51,745
The 50 EMA remains below the 100 EMA, confirming that the broader 4H momentum is still bearish.
However, after reaching approximately 50,500, price has produced a short-term rebound and is now testing an important resistance area around 51,150–51,500.
Key Resistance Levels
51,150–51,250
Immediate resistance. Price is currently testing this area.
51,500
Important horizontal resistance and previous support area. A sustained move above it would improve the short-term structure.
51,700–51,800
Major resistance around the 100 EMA and descending trendline.
52,200–52,500
Higher resistance zone if the index manages to establish a stronger recovery.
Key Support Levels
51,000–51,150
Immediate support around the current consolidation.
50,500–50,600
Major recent low and important structural support.
50,000
Psychological support if the 50,500 area fails.
Bullish Scenario
If Dow Jones manages to hold above 51,000–51,150 and breaks decisively above 51,500, the current rebound could extend toward the moving-average resistance around:
51,700–51,800
A sustained breakout above the 100 EMA would be more significant because it would begin to challenge the current bearish 4H structure.
Above that area, the next potential targets would be around 52,200–52,500.
Bearish Scenario
The broader trend remains bearish while price stays below the descending trendlines and moving averages.
If the current rebound is rejected around 51,150–51,500 and price breaks below 51,000, attention would shift toward:
50,500–50,600
A sustained break below 50,500 would strengthen the bearish scenario and could open the way toward the psychological 50,000 level.
Technical Outlook
The 4H structure is currently bearish, despite the short-term rebound from the 50,500 area.
The most important area in the near term is 51,150–51,500. A breakout above 51,500 could allow the recovery to continue toward the 100 EMA, while rejection from this zone would favor another test of the recent lows.
The 51,700–51,800 region is particularly important because it combines the 100 EMA with descending resistance.
Key levels to watch:
🟢 Bullish confirmation: Above 51,500
🎯 Upside targets: 51,750 / 52,200–52,500
🟡 Immediate support: 51,000–51,150
🔴 Bearish confirmation: Below 50,500
🎯 Downside target: 50,000
Disclaimer: Our market analysis is provided for informational and educational purposes only and should not be considered financial or investment advice or a recommendation to trade. The analysis represents a possible market perspective, and markets can move in any direction at any time. Always conduct your own research and consider the risks before making any trading decision.