
Market Structure
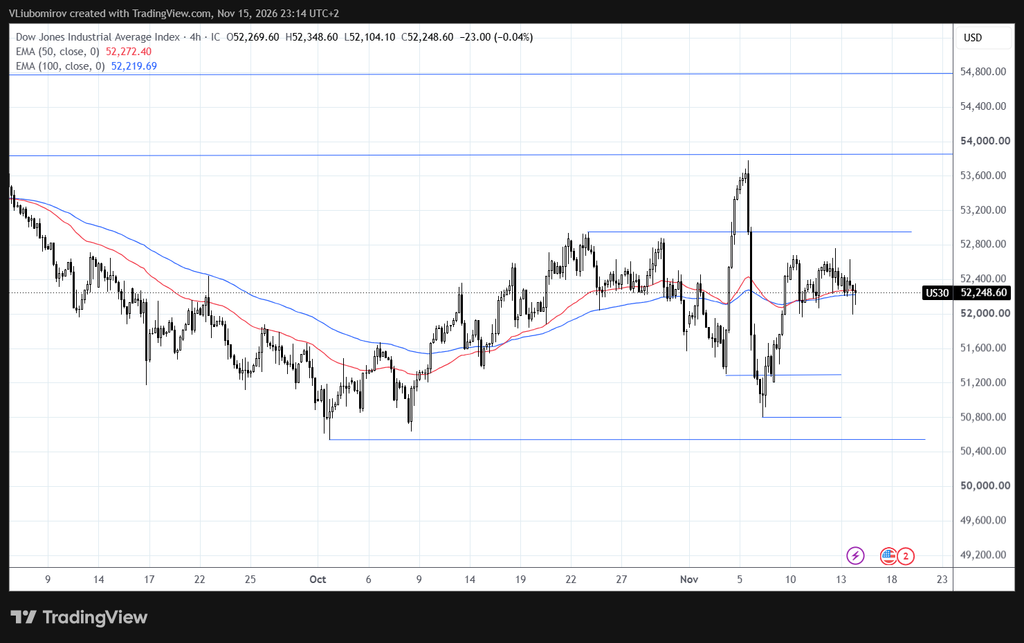
The Dow Jones is currently trading within a consolidation range following a strong recovery from the October lows.
After declining toward the 50,500 area in early October, the index established a recovery structure, reaching the 52,800–52,900 resistance zone in late October.
In early November, the market experienced significant volatility, including a sharp upward spike toward 53,700 followed by an equally strong reversal toward 50,800.
Since then, buyers have managed to recover most of the losses, but the index has struggled to establish a clear directional trend.
The current price is around 52,248, with the market moving sideways around both moving averages.
Moving Averages
EMA 50: 52,272.40
EMA 100: 52,219.69
Both moving averages are currently very close to each other and relatively flat, reflecting the lack of strong directional momentum.
The price is trading around both averages, suggesting a balanced market where neither buyers nor sellers have established clear control.
Key Resistance Levels
52,300–52,400 – Immediate resistance and current consolidation area.
52,900 – Major horizontal resistance and previous swing highs.
53,700–53,800 – Important resistance zone following the November spike.
54,800 – Higher resistance level.
Key Support Levels
52,000 – Immediate psychological support.
51,250 – Important support and recent November consolidation low.
50,800 – November swing low.
50,500 – Major support and October low.
Bullish Scenario
The first important challenge for buyers is to establish a sustained move above 52,400.
A successful breakout could open the way toward 52,900, where the market previously encountered strong selling pressure.
A confirmed break above 52,900 would improve the bullish outlook and potentially allow another attempt toward 53,700.
For a stronger bullish structure to develop, the index needs to establish higher highs and maintain support above the moving averages.
Bearish Scenario
The market remains vulnerable to further downside if buyers fail to defend the current consolidation area.
A confirmed break below 52,000 could expose the next support around 51,250.
If selling pressure increases and this level fails to hold, the index could revisit 50,800.
A break below 50,800 would significantly weaken the recovery structure and bring the major 50,500 support into focus.
Technical Outlook
The Dow Jones is currently showing a neutral-to-range-bound structure on the 4H timeframe.
Unlike the Nasdaq, which continues to show a clearer bearish structure, the Dow has managed to recover strongly from its November lows.
However, the inability to break above 52,900 and the convergence of EMA 50 and EMA 100 suggest that the market is currently lacking a clear directional trend.
The 52,000–52,400 region is important for the immediate outlook. A breakout from this area could provide the next directional signal.
For now, the short-term bias remains neutral, with a slight bullish possibility as long as the index holds above 52,000.
Key Levels to Watch
Resistance: 52,400 | 52,900 | 53,700–53,800 | 54,800
Support: 52,000 | 51,250 | 50,800 | 50,500
Bullish above: 52,400
Bearish below: 52,000
Disclaimer: Our market analysis is provided for informational and educational purposes only and should not be considered financial or investment advice or a recommendation to trade. The analysis represents a possible market perspective, and markets can move in any direction at any time. Always conduct your own research and manage your risk before making any trading decision.