
Market Structure
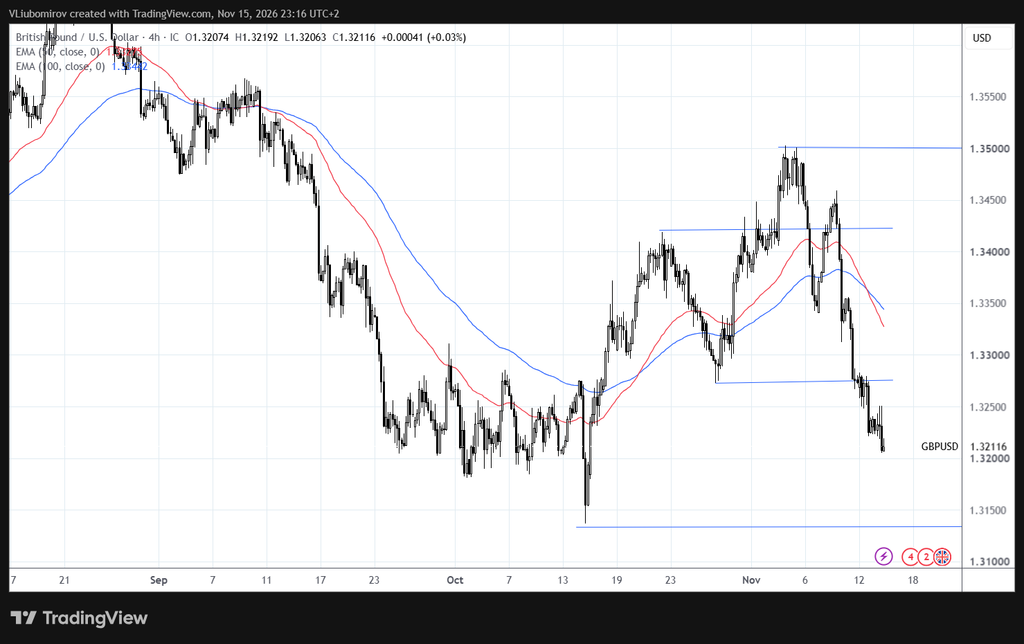
GBP/USD has shifted back into a bearish market structure on the 4H timeframe following a strong rejection from the 1.3500 resistance area.
After recovering throughout October and reaching a high near 1.3500 in early November, the pair experienced a sharp reversal. The price broke below the 1.3420 support zone and subsequently lost the important 1.3275 support level.
The current price is around 1.3212, with sellers maintaining control and the market continuing to form lower highs and lower lows.
The recent breakdown suggests that the previous bullish recovery has lost momentum and that the broader bearish structure is regaining control.
Moving Averages
EMA 50: 1.3330
EMA 100: 1.3374
EMA 50 is below EMA 100, confirming the bearish alignment.
Both moving averages are turning downward, while price is trading significantly below them. This indicates strong selling pressure and reinforces the current bearish outlook.
Key Resistance Levels
1.3275 – Previous support, now potential resistance.
1.3330 – EMA 50 resistance.
1.3375 – EMA 100 resistance.
1.3420 – Major resistance zone.
1.3500 – Recent swing high and major resistance.
Key Support Levels
1.3200 – Immediate psychological support.
1.3135 – Major support and previous swing low.
Bullish Scenario
A short-term recovery could develop if GBP/USD manages to stabilize above the 1.3200 psychological level.
A move back above 1.3275 would be the first indication of improving momentum and could open the way toward the EMA 50 around 1.3330.
However, the pair would need to reclaim the 1.3330–1.3375 region to weaken the current bearish structure.
Bearish Scenario
The bearish outlook remains dominant.
If the price continues trading below 1.3275, sellers could maintain control and push the pair toward the 1.3200 psychological support.
A decisive break below 1.3200 could expose the next major support around 1.3135.
A breakdown below this level would signal further bearish momentum and potentially open the door to additional downside.
Technical Outlook
GBP/USD remains bearish on the 4H timeframe following the recent breakdown below the 1.3275 support zone.
The price is trading well below both moving averages, which are now aligned in a bearish configuration.
Although a short-term corrective bounce cannot be ruled out after the recent decline, there are currently no clear signs of a bullish reversal.
The overall outlook remains bearish, with particular attention on the 1.3200 psychological level and the next major support around 1.3135.
Key Levels to Watch
Resistance: 1.3275 | 1.3330 | 1.3375 | 1.3420
Support: 1.3200 | 1.3135
Bullish above: 1.3330
Bearish below: 1.3200
Disclaimer: This market analysis is provided for informational and educational purposes only and should not be considered financial or investment advice or a recommendation to trade. Always conduct your own research and manage your risk before making any trading decision.