
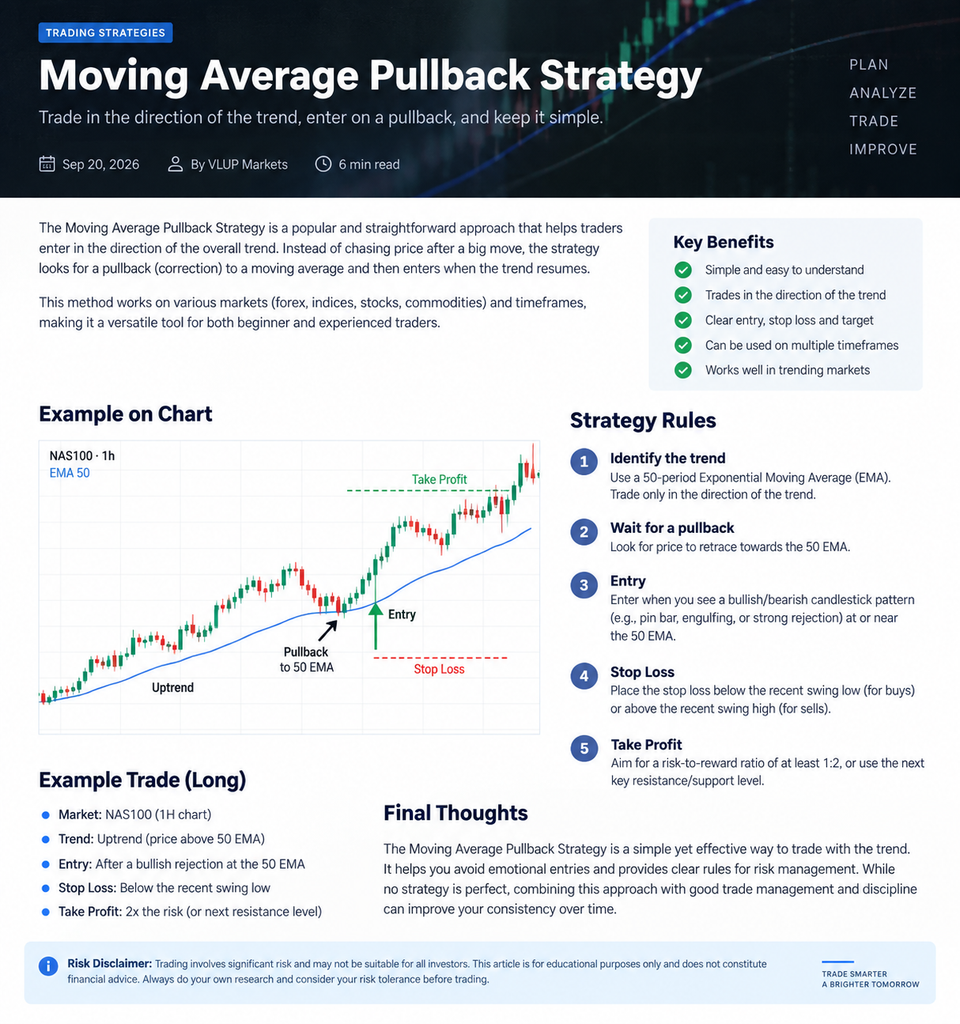
Trade with the trend. Wait for the correction. Enter with a defined risk.
The Moving Average Pullback Strategy is a simple trend-following approach designed to avoid chasing the market after a strong move.
The basic idea is straightforward: identify the current trend, wait for price to correct toward a moving average, and look for a confirmation before entering the trade.
This strategy can be applied to indices, forex, commodities and other liquid markets.
How the Strategy Works
For this example, we use a 50-period Exponential Moving Average (EMA 50).
1. Identify the Trend
First, determine the direction of the market.
For a long trade:
- Price is trading above the EMA 50.
- The EMA is generally moving upward.
- The market is making higher highs and higher lows.
For a short trade:
- Price is trading below the EMA 50.
- The EMA is generally moving downward.
- The market is making lower highs and lower lows.
The objective is to trade in the direction of the prevailing trend rather than trying to predict reversals.
2. Wait for a Pullback
After identifying the trend, do not enter immediately.
Wait for price to move back toward the EMA 50.
This correction can provide a better entry location compared with buying after a large bullish move or selling after a large bearish move.
The price does not necessarily have to touch the moving average exactly. The important part is that the market makes a meaningful correction toward the average.
3. Look for Confirmation
When price reaches the moving average area, wait for a sign that the original trend may be continuing.
Possible confirmation signals include:
- A bullish rejection candle for a long trade
- A bearish rejection candle for a short trade
- An engulfing candle
- A strong momentum candle
- A break of the previous candle’s high or low
The goal is to avoid entering simply because price has reached the moving average.
4. Entry
Long Setup
- Price is above the EMA 50.
- The market is in an uptrend.
- Price pulls back toward the EMA 50.
- A bullish confirmation appears.
- Enter the trade after confirmation.
Short Setup
- Price is below the EMA 50.
- The market is in a downtrend.
- Price pulls back toward the EMA 50.
- A bearish confirmation appears.
- Enter the trade after confirmation.
5. Stop Loss
Risk management is an important part of the strategy.
For a long trade, the Stop Loss can be placed below the most recent swing low.
For a short trade, the Stop Loss can be placed above the most recent swing high.
This gives the trade enough room to develop while defining the maximum amount that can be lost if the setup fails.
6. Take Profit
There are several ways to define the target.
One simple approach is to use a 1:2 risk-to-reward ratio.
For example:
- Risk = 50 points
- Target = 100 points
Another approach is to use the next important resistance level for a long trade or support level for a short trade.
The important point is to define the target before entering the position.
Example
Imagine NAS100 is trading above the EMA 50 and the overall structure is bullish.
Price makes a strong move higher and then begins to correct.
Instead of buying immediately, we wait for the correction toward the EMA 50.
Price reaches the EMA area and forms a bullish rejection candle.
A long position can then be considered.
Example setup:
- Market: NAS100
- Timeframe: 1H
- Trend: Bullish
- Moving Average: EMA 50
- Entry: Bullish confirmation near EMA 50
- Stop Loss: Below the recent swing low
- Take Profit: 2× the initial risk
The same logic can be reversed for a bearish setup.
Important Considerations
This strategy is designed primarily for trending markets.
During sideways or highly choppy conditions, price can repeatedly cross the moving average and create false signals.
For this reason, traders should consider the broader market structure and avoid treating every touch of the moving average as an automatic entry.
No strategy produces profitable trades every time. The objective is to combine a repeatable setup with consistent risk management and disciplined execution.
Final Thoughts
The Moving Average Pullback Strategy provides a simple framework:
Trend → Pullback → Confirmation → Entry → Stop Loss → Target
Keeping the rules simple can help reduce emotional decisions and make the strategy easier to test and evaluate.
Before using the strategy with real money, test it on historical data and, if possible, on a demo account. Pay particular attention to win rate, average risk-to-reward, drawdown and performance across different market conditions.
Risk Disclaimer: Trading financial markets involves significant risk and may not be suitable for all investors. This article is for educational purposes only and does not constitute financial advice.