
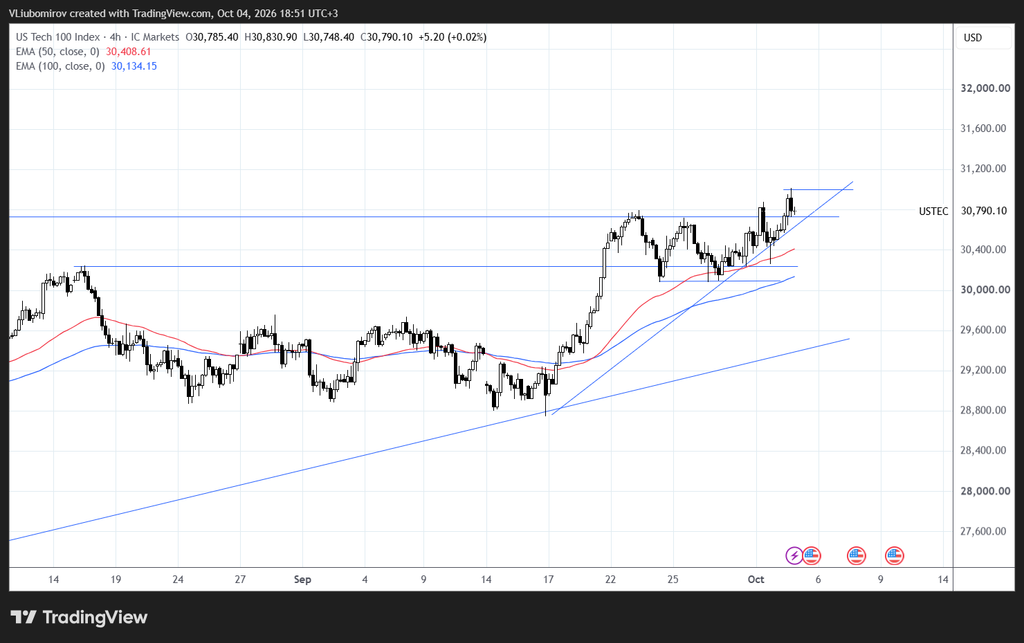
Current Price: 30,790
Timeframe: 4H
Market: US Tech 100 / Nasdaq 100
Market Structure
Nasdaq 100 is showing a bullish short-term structure on the 4H chart. After recovering strongly from the 28,800–29,000 area, price broke above the previous consolidation zone and established a series of higher highs and higher lows.
The index is currently trading around 30,790, above both the 50 EMA (30,409) and 100 EMA (30,134). The two moving averages are also positioned bullishly, with the 50 EMA above the 100 EMA.
Price is approaching the recent highs, making the 30,800–31,000 region particularly important.
Key Resistance Levels
30,800–30,900
Immediate resistance around the current price and recent highs.
31,000–31,100
Major psychological and technical resistance. A sustained breakout above this area would strengthen the bullish structure.
31,200
Next potential upside level if the breakout continues.
Key Support Levels
30,400–30,500
First important support, near the 50 EMA and recent price structure.
30,100–30,200
Important support around the 100 EMA and previous consolidation area.
29,600–29,700
Deeper support from the previous breakout structure.
28,800–29,000
Major structural support and the origin of the latest strong upward move.
Bullish Scenario
If Nasdaq 100 maintains its position above 30,400–30,500 and breaks decisively above 30,900–31,000, the current bullish structure could continue.
A confirmed breakout could open the way toward:
31,100 → 31,200+
The rising trendline visible on the chart also supports the current bullish structure as long as price continues to form higher lows.
Bearish Scenario
A rejection from the 30,800–31,000 resistance zone followed by a break below 30,400 would signal increasing short-term weakness.
In that case, attention would shift toward:
30,100–30,200
A sustained break below the 100 EMA could lead to a deeper retracement toward 29,600–29,700.
A break below 29,600 would significantly weaken the current bullish structure and bring the 28,800–29,000 area back into focus.
Technical Outlook
The overall 4H structure remains bullish.
Price is above both moving averages, the 50 EMA is above the 100 EMA, and the ascending trendline remains intact. However, Nasdaq 100 is now approaching a significant resistance zone around 30,800–31,000, so confirmation of a breakout is important before assuming further upside.
Key levels to watch:
🟢 Bullish confirmation: Above 31,000
🎯 Upside targets: 31,100 / 31,200+
🟡 First support: 30,400–30,500
🔴 Bearish confirmation: Below 30,100
🎯 Downside levels: 29,600 / 28,800–29,000
Disclaimer: Our market analysis is provided for informational and educational purposes only and should not be considered financial or investment advice or a recommendation to trade. The analysis represents a possible market perspective, and markets can move in any direction at any time. Always conduct your own research and consider the risks before making any trading decision.