
Market Structure
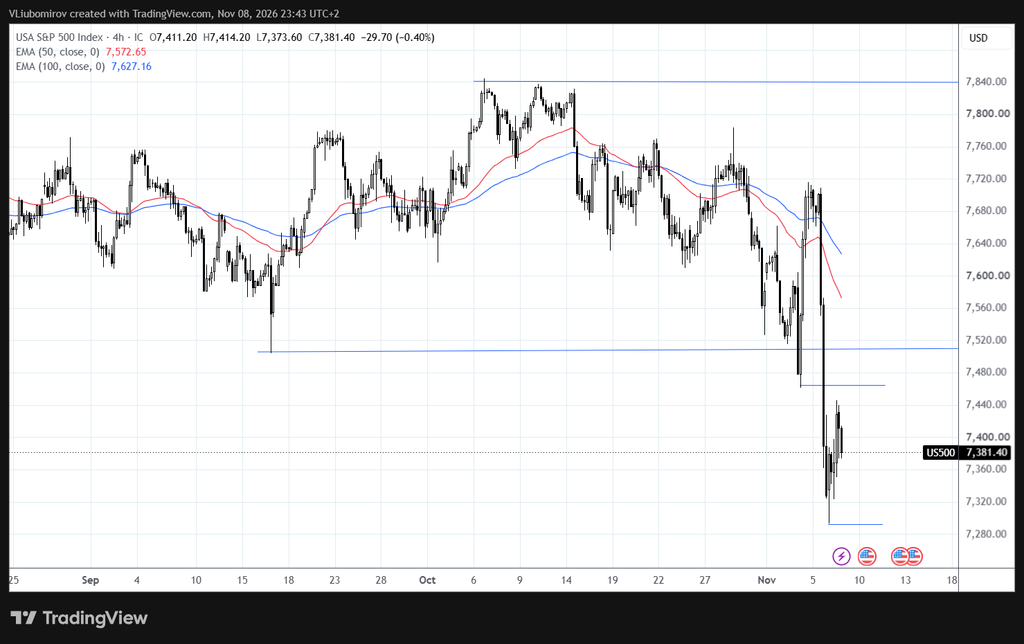
The S&P 500 has experienced a significant bearish move after failing to maintain its position above the 7,700–7,760 resistance area. Selling pressure accelerated in early November, leading to a sharp breakdown below the previous support levels around 7,510 and 7,460.
The index is currently trading around 7,381 after a strong sell-off and a volatile rebound from the recent low near 7,290. The overall market structure remains bearish, with lower highs and lower lows dominating the recent price action.
Moving Averages
EMA 50: 7,572.65
EMA 100: 7,627.16
Both moving averages are positioned above the current price and are turning downward, confirming strong bearish momentum. The 7,570–7,630 area represents an important resistance zone.
Key Resistance Levels
7,460 – Immediate resistance.
7,510 – Previous support, now potential resistance.
7,570–7,630 – EMA 50 and EMA 100 resistance zone.
7,840 – Major resistance.
Key Support Levels
7,360 – Immediate support area.
7,290 – Recent swing low and important support.
Bullish Scenario
A recovery above 7,460 could provide the first indication of short-term stabilization.
A sustained move above 7,510 would improve the short-term outlook and could open the way toward the 7,570–7,630 EMA resistance zone.
However, a stronger bullish reversal would require the price to reclaim both moving averages and establish a higher high.
Bearish Scenario
If the index fails to recover above 7,460 and selling pressure resumes, another test of the 7,290 support level becomes likely.
A confirmed breakdown below 7,290 would signal further weakness and could open the way for an additional downward move.
As long as the price remains below both moving averages, the bearish scenario remains dominant.
Technical Outlook
The overall 4H structure remains strongly bearish. The sharp breakdown below key support levels, combined with the downward-sloping moving averages, indicates that sellers currently maintain control.
The 7,460 and 7,510 levels are important resistance areas, while 7,290 represents the key support to watch.
A sustained recovery above 7,510 would be needed to improve the short-term technical outlook. Until then, downside risks remain elevated.
Key Levels to Watch
Resistance: 7,460 | 7,510 | 7,570–7,630
Support: 7,360 | 7,290
Bullish above: 7,510
Bearish below: 7,290
Disclaimer: Our market analysis is provided for informational and educational purposes only and should not be considered financial or investment advice or a recommendation to trade. The analysis represents a possible market perspective, and markets can move in any direction at any time.