
Market Structure
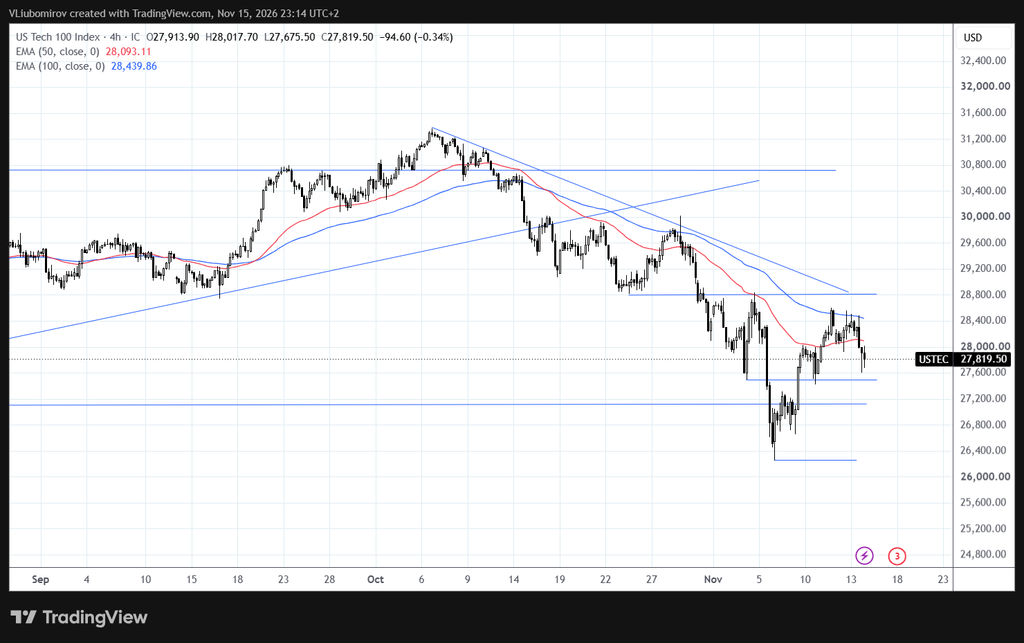
The Nasdaq 100 remains in a bearish market structure on the 4H timeframe, despite a recent recovery from the November lows.
After reaching the October highs near 31,300, the market entered a sustained downward movement, forming a sequence of lower highs and lower lows.
The sharp decline in early November pushed the price toward the 26,300 area, where buyers stepped in and triggered a recovery toward 28,500.
However, the latest price action shows renewed selling pressure, with the index falling back toward 27,819. The recovery appears to be losing momentum as the price struggles to remain above the moving averages.
Moving Averages
EMA 50: 28,093.11
EMA 100: 28,439.86
The EMA 50 remains below the EMA 100, confirming the prevailing bearish alignment.
Both moving averages are pointing downward, while the current price is trading below them. This suggests that sellers continue to have the upper hand.
Key Resistance Levels
28,100 – EMA 50 and immediate resistance.
28,440–28,500 – EMA 100 and recent recovery highs.
28,800 – Important horizontal resistance and previous support.
30,700 – Major resistance zone.
Key Support Levels
27,500 – Immediate support and recent consolidation area.
27,200 – Important horizontal support.
26,250 – November swing low and major support.
Bullish Scenario
The first important level for buyers is 27,500.
If the index manages to hold above this area and recover above 28,100, it could attempt another move toward 28,440–28,500.
A sustained breakout above the EMA 100 and the descending trendline would provide a stronger indication that the recovery could continue.
The 28,800 level remains the next major upside target.
Bearish Scenario
The overall technical structure remains bearish.
The recent recovery toward 28,500 failed to establish a sustained move above the moving averages, and the price has returned below the EMA 50.
A confirmed break below 27,500 could expose the next support around 27,200.
If selling pressure continues and this level fails to hold, the market could revisit the November low near 26,250.
Technical Outlook
The Nasdaq 100 continues to show a bearish structure on the 4H timeframe.
Although buyers managed to generate a strong recovery from the November lows, the price has failed to overcome the descending moving averages and resistance around 28,500.
The recent rejection suggests that sellers are still active and that the recovery may have been corrective rather than the beginning of a new bullish trend.
The 27,500–27,200 support zone is particularly important in the coming sessions. Holding this area could allow another recovery attempt, while a confirmed breakdown would increase the probability of a retest of the November lows.
For now, the short-term bias remains bearish while the index trades below 28,100–28,500.
Key Levels to Watch
Resistance: 28,100 | 28,440–28,500 | 28,800 | 30,700
Support: 27,500 | 27,200 | 26,250
Bullish above: 28,500
Bearish below: 27,500
Disclaimer: Our market analysis is provided for informational and educational purposes only and should not be considered financial or investment advice or a recommendation to trade. The analysis represents a possible market perspective, and markets can move in any direction at any time. Always conduct your own research and manage your risk before making any trading decision.