
Market Structure
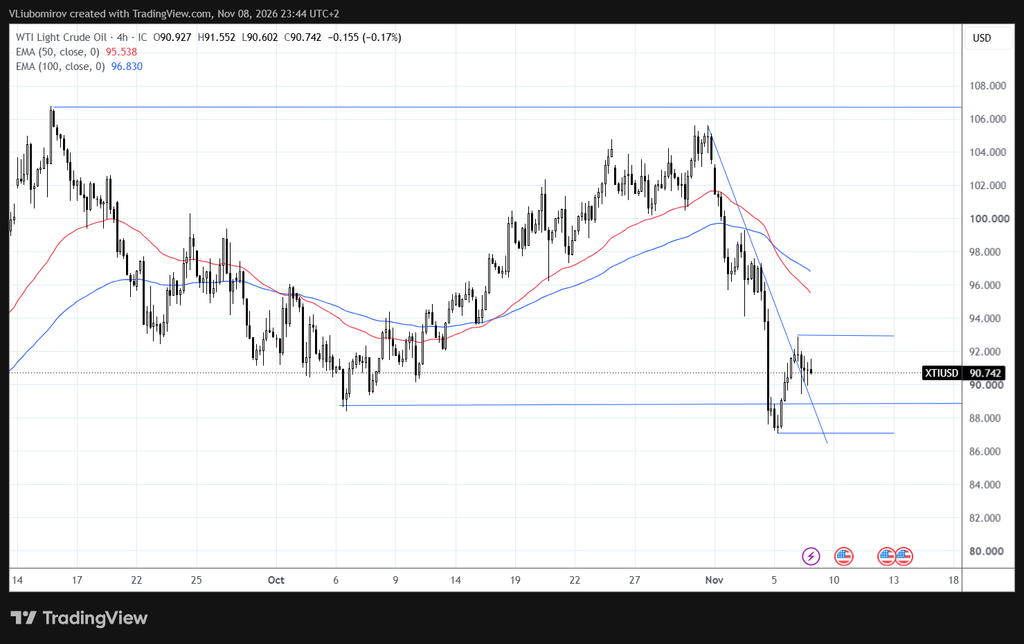
WTI Crude Oil remains under strong bearish pressure following a sharp reversal from the 105.00–106.00 resistance area. The decline accelerated in early November, pushing the price below both the 50 and 100 EMAs and breaking several important support levels.
After reaching a low near 87.00, the market experienced a short-term rebound toward 92.00–93.00. However, the recovery has lost momentum, and the price is currently trading around 90.74.
The broader 4H structure remains bearish, with the descending trendline continuing to limit upside movements.
Moving Averages
EMA 50: 95.54
EMA 100: 96.83
Both moving averages are positioned well above the current price and are pointing downward, confirming the prevailing bearish trend. The 95.50–96.80 area represents an important resistance zone.
Key Resistance Levels
92.00–93.00 – Immediate resistance and recent rebound high.
95.50 – EMA 50 resistance.
96.80 – EMA 100 resistance.
106.70 – Major resistance.
Key Support Levels
90.00 – Immediate support area.
88.80 – Important horizontal support.
87.00 – Recent swing low and major support.
Bullish Scenario
If oil manages to hold above 90.00 and regain upward momentum, another attempt toward 92.00–93.00 could follow.
A confirmed breakout above 93.00 would improve the short-term outlook and could open the way toward the 95.50 EMA resistance.
However, a stronger bullish reversal would require the price to reclaim both moving averages and break the broader descending structure.
Bearish Scenario
Failure to maintain the 90.00 level could expose the 88.80 support zone.
A confirmed breakdown below 88.80 would increase the probability of a retest of the recent low around 87.00.
A break below 87.00 could signal further downside continuation.
As long as the price remains below both moving averages, the bearish scenario remains dominant.
Technical Outlook
The overall 4H structure remains strongly bearish. The sharp decline from the November highs, the position of both moving averages, and the descending trendline indicate that sellers continue to control the market.
The recent rebound has not yet produced a confirmed trend reversal. The 92.00–93.00 resistance zone is particularly important for determining whether buyers can regain control.
A sustained move above 93.00 would improve the short-term outlook, while a breakdown below 88.80 could expose the 87.00 support area.
Key Levels to Watch
Resistance: 92.00–93.00 | 95.50 | 96.80
Support: 90.00 | 88.80 | 87.00
Bullish above: 93.00
Bearish below: 88.80
Disclaimer: Our market analysis is provided for informational and educational purposes only and should not be considered financial or investment advice or a recommendation to trade. The analysis represents a possible market perspective, and markets can move in any direction at any time.